
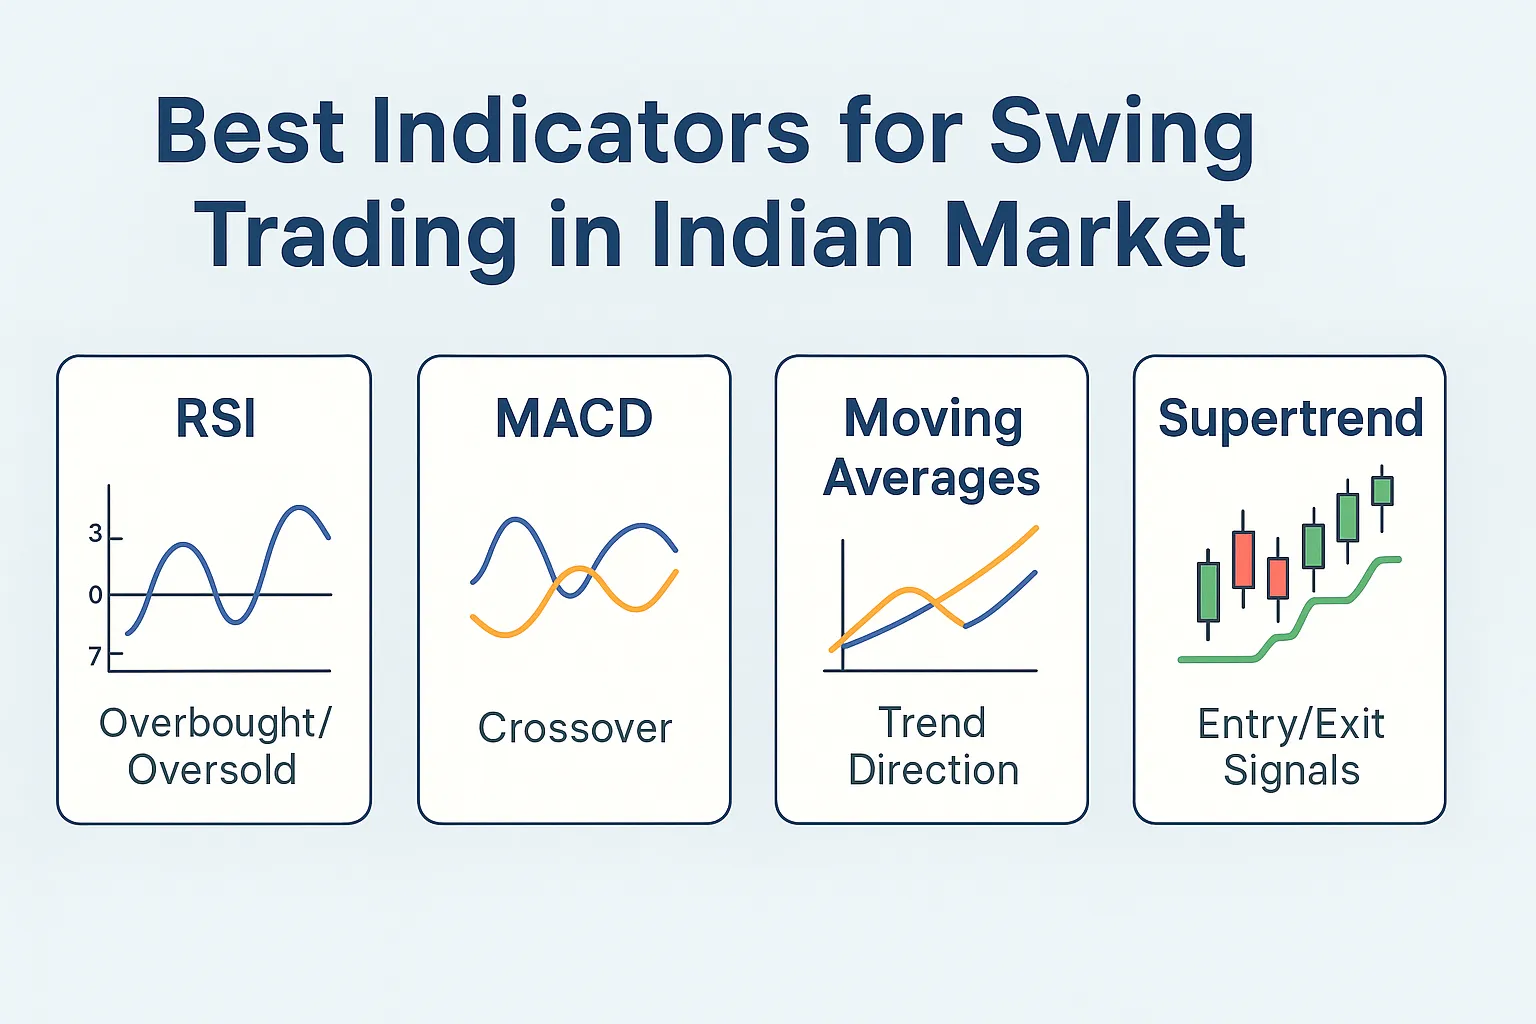
Best Indicators for Swing Trading in Indian Market
If you’re serious about swing trading in India, using the right technical indicators can significantly improve your entries and exits. Swing trading focuses on capturing short- to medium-term price moves, usually over a few days to weeks. Indicators help you spot momentum shifts, confirm trends, and manage your trades effectively.
In this guide, we’ll break down the best indicators for swing trading in the Indian stock market, with practical examples and tips.
1. Relative Strength Index (RSI)
Purpose: Identifies overbought and oversold conditions
Default Setting: 14
Best Used On: Daily charts
How to Use:
- RSI < 30 → Oversold = Look for bounce setups
- RSI > 70 → Overbought = Caution or exit signals
- RSI Divergence → Early reversal signs
Combine RSI with support/resistance for powerful swing entries.
2. MACD (Moving Average Convergence Divergence)
Purpose: Confirms trend direction and momentum
Default Settings: 12, 26, 9
Best Used On: Daily charts for confirmation
How to Use:
- Bullish crossover = MACD line crosses above Signal line
- Bearish crossover = MACD line crosses below Signal line
- Works well with RSI and trendlines
Use MACD near zero line for clean trend confirmation.
3. Moving Averages (50 EMA & 200 EMA)
Purpose: Defines overall trend direction
Best Used On: Daily and weekly charts
How to Use:
- Price above 50 EMA → Uptrend bias
- Golden Cross → 50 EMA crosses above 200 EMA = Bullish signal
- Use MAs as dynamic support/resistance in trending markets
Great for filtering stocks during swing scanning.
4. Supertrend Indicator
Purpose: Trend-following tool with entry/exit signals
Common Settings: 10, 3 or 7, 2
Best Used On: Daily charts for swing trades
How to Use:
- Buy signal = Green line below price
- Sell signal = Red line above price
- Use in trending markets, not sideways conditions
Combine Supertrend with RSI for clean momentum trades.
5. Volume and Volume Oscillator
Purpose: Confirms strength of price moves
Best Used On: Daily chart
How to Use:
- Look for volume spikes on breakout candles
- Rising volume with rising price = bullish confirmation
- Avoid low-volume breakouts
Volume gives you conviction to hold swing trades longer.
6. ATR (Average True Range)
Purpose: Measures stock volatility
Best Used For: Stop-loss placement and position sizing
How to Use:
- Use 1–1.5× ATR below your entry for stop-loss
- Avoid stocks with abnormally high ATR in sideways phases
Helps manage risk with dynamic stop-loss placement.
How to Combine Indicators for Swing Trading
Here’s a powerful combo for Indian stocks:
- Entry: RSI < 40 (oversold zone) + Supertrend Buy + Price at 50 EMA
- Confirmation: MACD Bullish Crossover
- Volume: Spike on entry candle
- Exit: RSI > 70 or trailing stop near Supertrend
Final Thoughts
No single indicator guarantees profits, but when used together, these tools can help you make smarter swing trading decisions. The Indian market is ideal for swing trading due to frequent trends and volatility in Nifty 50, midcaps, and sector leaders.
Master these indicators, build your swing trading plan, and always follow proper risk management.
FAQs
What is the best indicator for swing trading in India?
RSI and Moving Averages are the most widely used and reliable indicators for swing trading.
Can I use multiple indicators together?
Yes. Combining 2–3 indicators gives stronger confirmation and avoids false signals.
Which chart timeframe is best for swing trading?
Daily charts are the most effective for swing trading analysis in India.
Should I use indicators alone?
No. Combine them with price action, support/resistance, and volume for best results.
Is Supertrend good for swing trading?
Yes. Supertrend is excellent for identifying clean trends when combined with other momentum tools.